 GitHub
GitHub
GitHub
Interactive companions
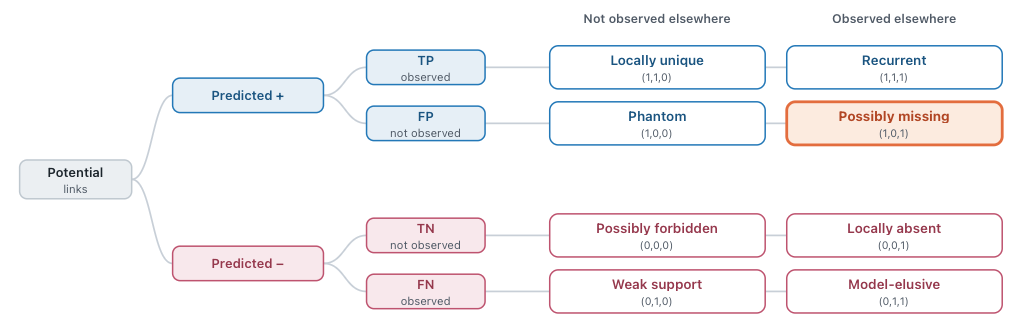
Link prediction returns candidate interactions, not evidence that they exist. This framework reads the variation between replicated networks as evidence, sorting predicted links into eight classes that each carry a specific next action: sample more, switch method, or accept what you have. These two tools let you explore that taxonomy directly.
Box 2
A Bayesian reading of the taxonomy. Class labels are claims about a link's hidden state, so how much confidence does a given evidence pattern actually earn?
Box 3 · Cabrera island
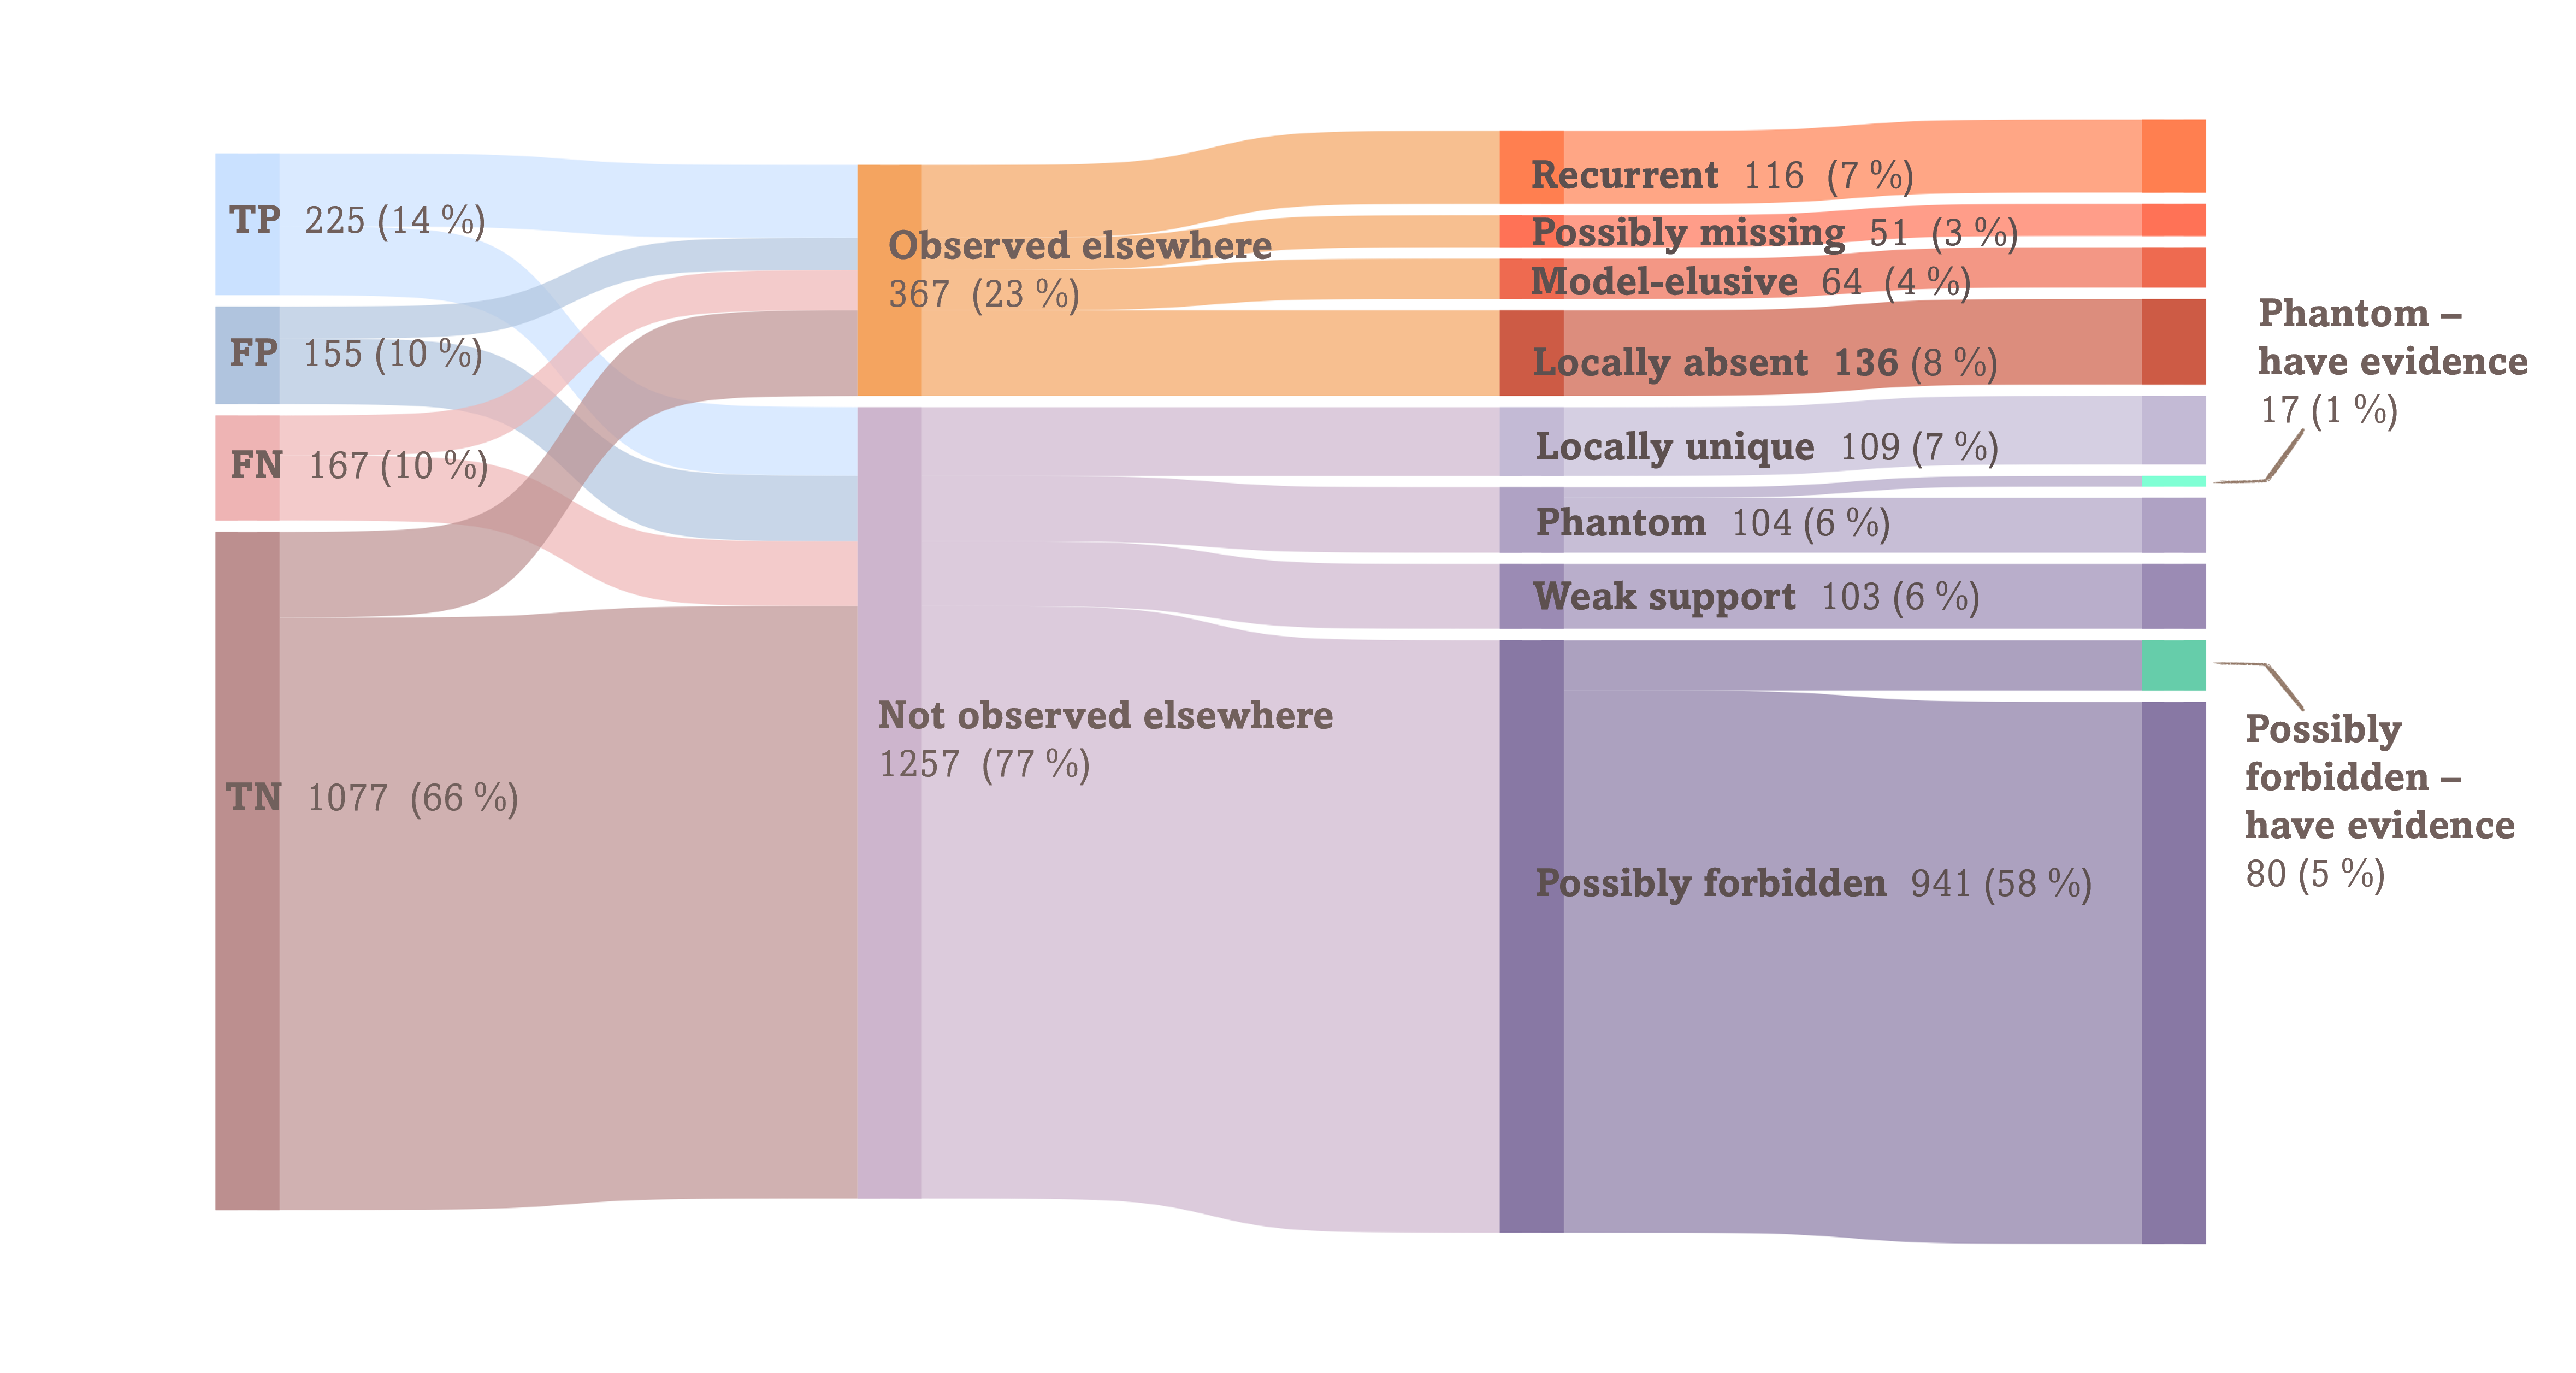
The framework applied to a real plant–pollinator system: six sites, two sampling methods, and 1624 candidate interactions sorted into where effort is actually worth spending.
Data: plant–pollinator interaction networks recorded at six sites on Cabrera island (Balearic archipelago, western Mediterranean), monitored by direct field observation and automated cameras in parallel at every site. That second, independent method is what makes it possible to test the framework's recommendations rather than only state them. Interactions were predicted within each site separately using rank-2 SVD matrix completion under a leave-one-out scheme, then classified against the other five sites as contextual evidence. 23 plant species × 69 pollinator species across 6 sites. Data originally published by Serra-Marin et al. (2025): Serra-Marin, P. E., Solé-Ribalta, A., Lana, A., Borge-Holthoefer, J., Hervías-Parejo, S., & Traveset, A. (2025). Comparative assessment of automated and manual monitoring in comprehensive plant–pollinator communities. Methods in Ecology and Evolution, 16, 2960–2978.